

In the following segment from DNA for Native American Genealogy, author Roberta Estes explains the percentage of Native DNA one is likely to possess and how the science of population genetics comes into play in establishing that relationship.
“How Much of Them is in Me?”
As discussed earlier, while everyone inherits exactly half of each parent’s autosomal DNA on chromosomes 1-22, you don’t inherit exactly 25% of your grandparents’ DNA. However, we use that as an approximation because as a group, an average is the best we can do.
Using the expectation that, on average the DNA of each ancestor is halved in each generation, you can expect to inherit about 6.25% of your great-great-grandparent’s DNA (see the following chart).
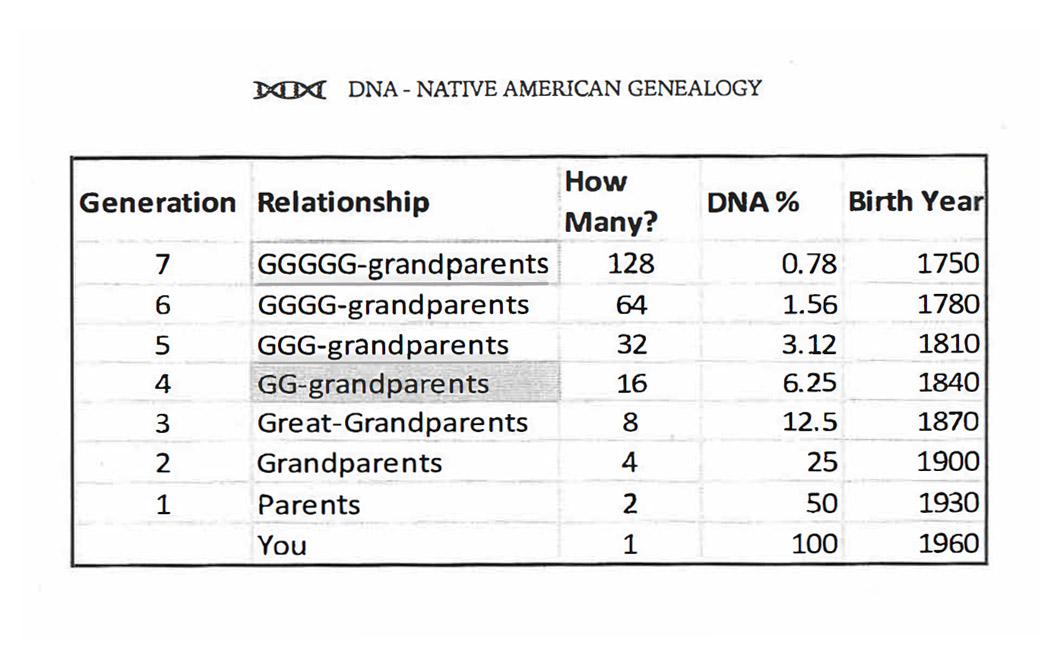
The amount of DNA that you inherit from an ancestor born in 1750, using a 30-year average generation, shrinks to just under 1%. By the time you reach sixth- and seventh-generation ancestors, assuming you inherit any of their DNA at all in recognizable quantities, you’re in the trace range of all the vendors.
If your ancestor born in 1750 was entirely Native, with no admixture, and you do in fact inherit .78% of their DNA, that would equate to approximately 26 CM of DNA. That’s not a trivial segment of DNA, but the challenge is that it’s unlikely you inherited their DNA in one large segment. It’s much more likely to be chopped up in smaller segments, some of which may not be able to be recognized as Native due to their size and other factors. Remember, you may not have inherited any discernible DNA from an ancestor seven generations back in time.
To put things in perspective, the Indian Removal occurred between 1830 and 1835, and by that time, many Native people east of the Mississippi were significantly admixed. The Cherokee Chief during the relocation, James Vann, was himself the son of a mixed mother and a white trader father.62
Your Native ancestor may not have been fully Native, which means you may have less Native DNA than you would expect, or none at all.
How is Native DNA determined or recognized in your DNA? How do we know what DNA is Native and what came from another population? How does this work?
The answer is found in Population Genetics.
Population Genetics
Population genetics is the study of genetics within specific population groups around the world– meaning how they are alike and how they are collectively different from other population groups.
The term most commonly used today is ethnicity, but the actual definition of ethnicity refers to someone who is a member of a social group of common national or cultural traditions. Race is typically biological, and both terms have been intermixed and confused for years.
Dr. Doug McDonald developed what is known as BGA, or Biogeographical Analysis (sometimes called Biogeographical Ancestry)63. BGA is the estimation of one’s biological, ethnic, or geographical origins based on identical sequences of DNA at a particular address that is more prevalent within a given population. The term BGA never caught on.
The primary [genealogy DNA] vendors use the following terms to describe people’s percentages of ethnicity/ population origins:
- 23andMe—Ancestry Composition, ancestral breakdown of 45 populations
- Ancestry—Ethnicity Estimate for geographic regions and also for Genetic Communities
(1,400+ geographies reported, combined between both features) - MyHeritage—Ethnicity Estimate and Genetic Groups (42 ethnicities, 2,114 Genetic Groups reported)
- FamilyTreeDNA—myOrigins64, ancestral breakdown and painting of 90 population clusters
Unfortunately, other terms never became widely adopted in a generic sense, so we will be using the terms “ethnicity,” “populations,” and “origins” because that’s how these results are widely known.
How Does Population Genetics Work?
A cluster of markers, or a genetic sequence, let’s say AAAAAAAAAA at a particular genetic address, is found in a specific population 90% of the time, and in the rest of the world’s population between 0%—10% Of the time. Let’s call the population where this sequence is found 90% of the time “the Blue Finnish People.”
Therefore, when a testing company discovers AAAAAAAAAA at that location for a customer, they infer that the customer may be related to the Blue Finnish People and classify them as such. Keep in mind that there is a 10% chance that classification is wrong, assuming the DNA segment descends from one parent and is not a result of random recombination.
Of course, the Blue Finnish People’s segment of DNA may be found in multiple geographies. Let’s say this population originated in Europe and is found most frequently today in Finland, followed by Lithuania and Russia65. In other words, the population settled in regions that today fall into different, multiple countries.
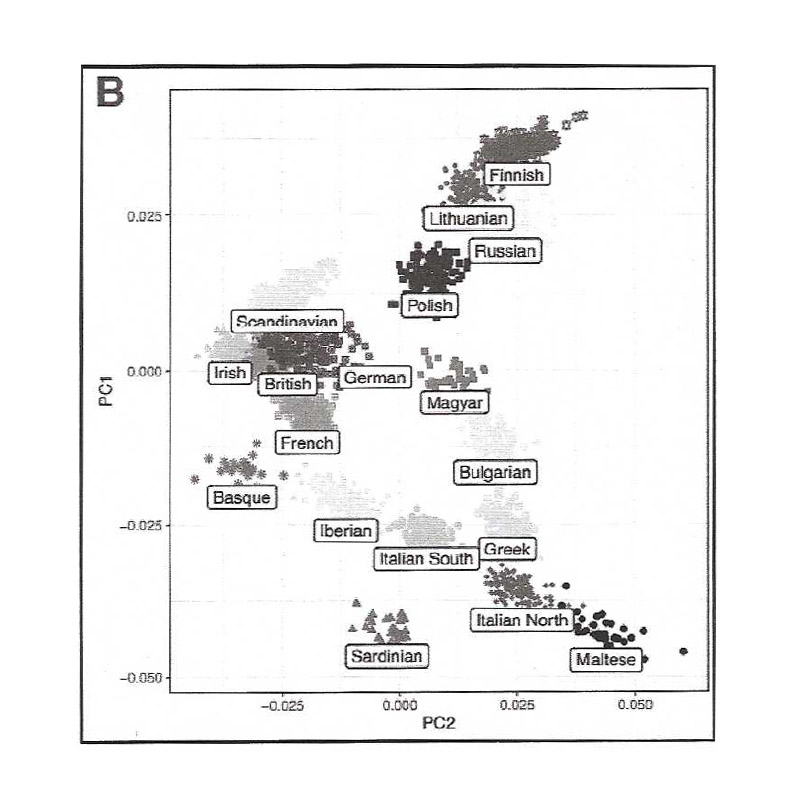
You can see that the PCA (Principal Component Analysis) graphic above shows Finnish at the top, closely related and overlapping with the Lithuanian and Russian populations. Of course, a vendor might assign the tester to the Finnish group, but the tester’s ancestor might actually be Lithuanian or Russian, or maybe even Polish, where the segment is found in slightly lower average frequencies. Of course, the tester could also belong to any other region where the segment frequency is found at 10% or less, as described.
___________________________
62https://en.wikipedia.org/wiki/James_Vann.
63https://dna-explained.com/2012/09/09/doug-mcdonald-on-biogeographical-analysis/;https://isogg.org/wiki/Biogeographical_ancestry.
64https://blog.familytreedna.com/wp-content/uploads/2021/08/myOrigins_3_WhitePaper.pdf
65PCA plot image, Figure B, courtesy FamilyTreeDNA myOrigins3.0 white paper at https://blog.familytreedna.com/wp-content/uploads/2021/08/myOrigins_3_WhitePaper.pdf.